Posted on
July 22, 2025
I was cruising through audio YouTube recently and I stumbled on a video about an interesting app that lets you paint on a canvas and generate sound. It’s called Metasynth, and it’s essentially like any other music production software (or “DAW”) — but it’s primary feature is sculpting sounds using a 2D canvas you “paint” inside of.
I’ve been experimenting with web audio and graphics a bit recently, so I thought it’d be a great exercise to try and replicate some of this app’s functionality in JavaScript.
I’ll go over how I made an app where the user can paint inside using p5.js. And then take that image data and convert it to sound data (and inevitably play it using the Web Audio API).
You can check out the source code here if you want to follow along.
What is Metasynth?
Metasynth is a MacOS app that lets you produce and synthesize music. I called it a “DAW” earlier, or Digital Audio Workstation. This is a common term that refers to a piece of software that lets musicians create music digitally, usually laying down “notes” in a “sequence”. You might have seen or used a DAW before if you’ve encountered apps like GarageBand, FL Studio, Ableton, or maybe an app.
Metasynth differs from the average DAW with a few key features, like it’s “Image Synth” mode that lets you paint to control sound. Or a “Spectrum Synth” that lets users take pre-existing audio samples, generate a spectrograph, and then manipulate the spectrograph to synthesize new sounds.
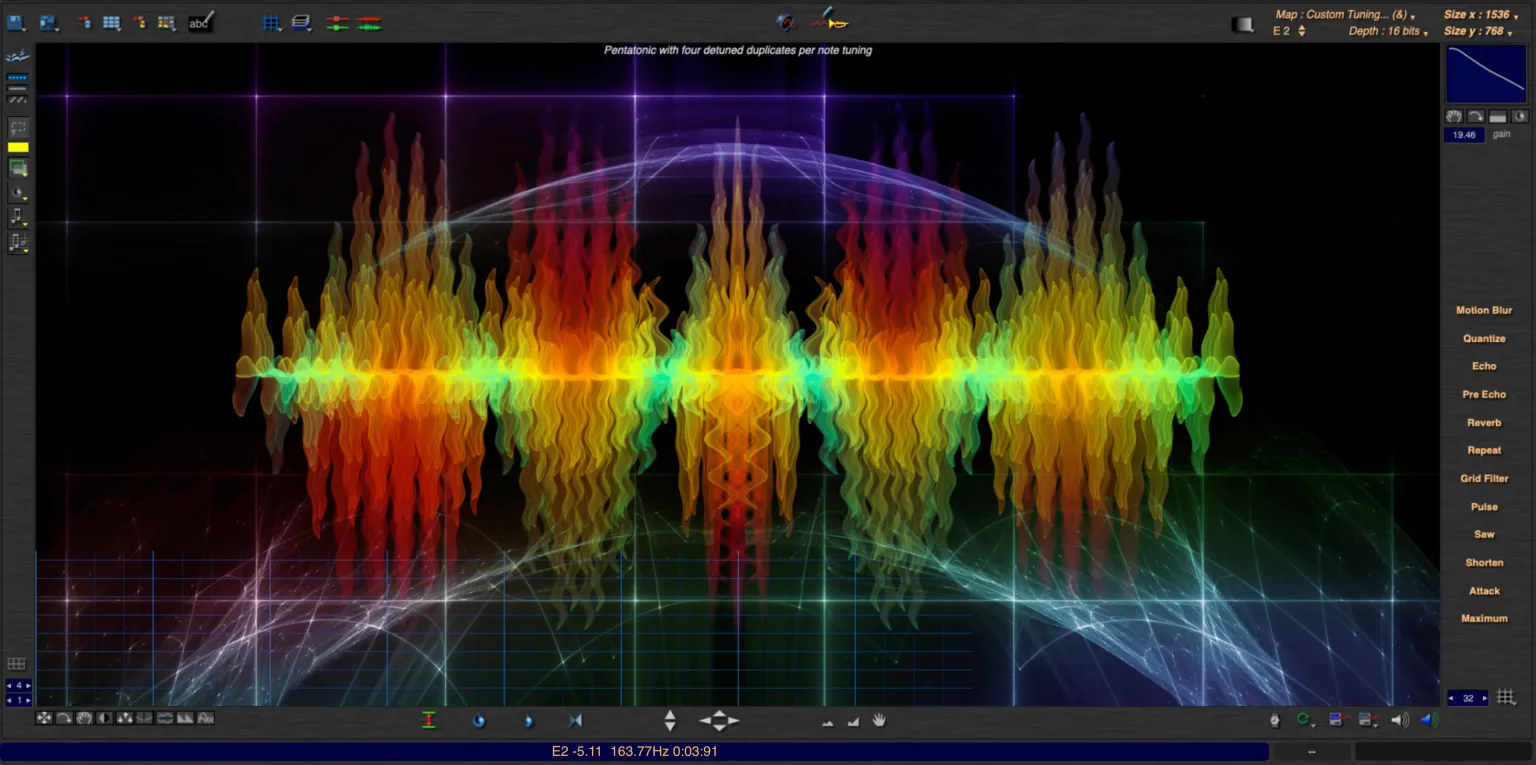
It has a few other interesting features, but we’ll be focused primarily on the “Image Synth” one today.
How does Image Synth work?
I mentioned the user can “paint” on a canvas to control sound. How does that work? The video I mentioned earlier does a nice job of explaining it.
You work with 3 colors: red, green, and yellow. These represent different channels of audio. Red and green are stereo channels, and the yellow is a “mono” channel (basically going to left and right stereo channels).
The canvas is divided into vertical segments that represent different “frequencies” or “pitches” (aka what note “letter” is being played in a single octave). The horizontal axis represents time, so as the audio is played, we use information from horizontal slices of the canvas. You can imagine the whole length as the duration of 1 sample (like say - 4-6 seconds depending on what you want), and we grab tiny 0.01 second slices of it at a time.
When we hit play, we start from the left side of the drawing and start moving closer to right side the more time passes. Sound will play based on where we draw on the canvas.
If we draw a green line going from bottom left to top right, it’d sound like the pitch was slowly increasing over time (going from sounding low to high).
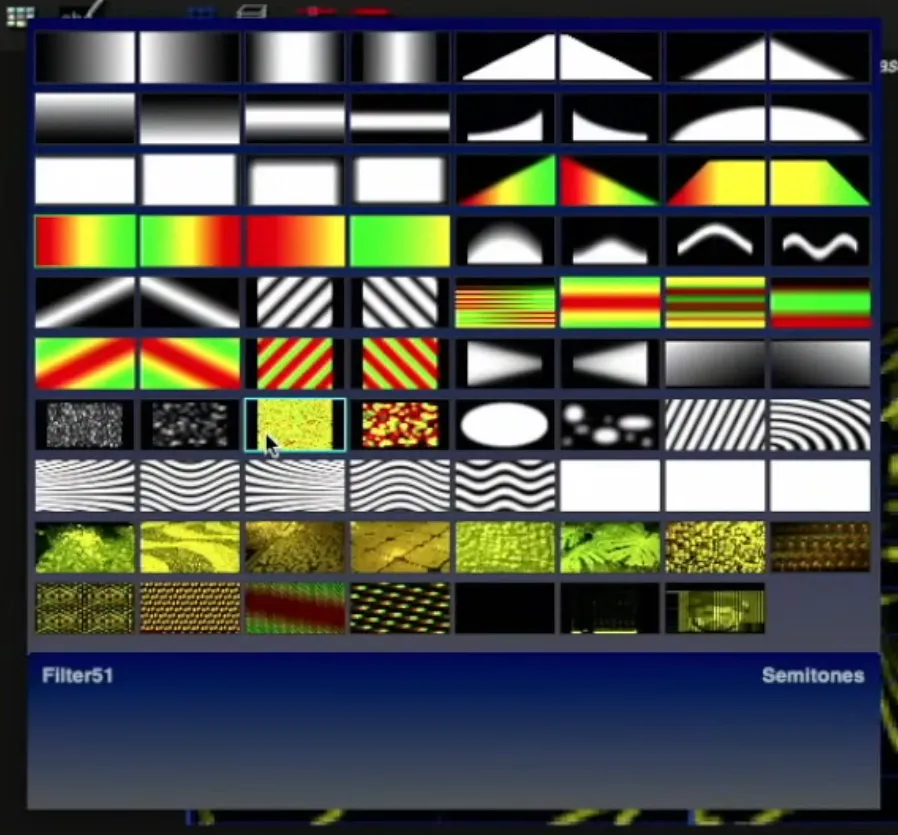
There are a multitude of other cool features, like preset filters, and operations you can run on the image (like scaling it - or “quantizing” it in a way). We’ll be focused on recreating the core functionality of the app.
Drawing on canvas
The first step to making this app is being able to draw or “paint”. Luckily this is pretty easy on the web using the HTML Canvas API. And we’ll make it even easier by leveraging p5.js, a library built on top of the canvas that simplifies drawing.
⚠️ I’ll be doing all this in React, but you can copy most of this code out to vanilla JS (or other frameworks) if needed. I’ll also be using some intermediate to advanced features of p5, make sure you’re familiar with at least the basics.
Drawing 101
With p5, when we want to draw we use the draw() lifecycle to run commands like circle() (which draws a circle).
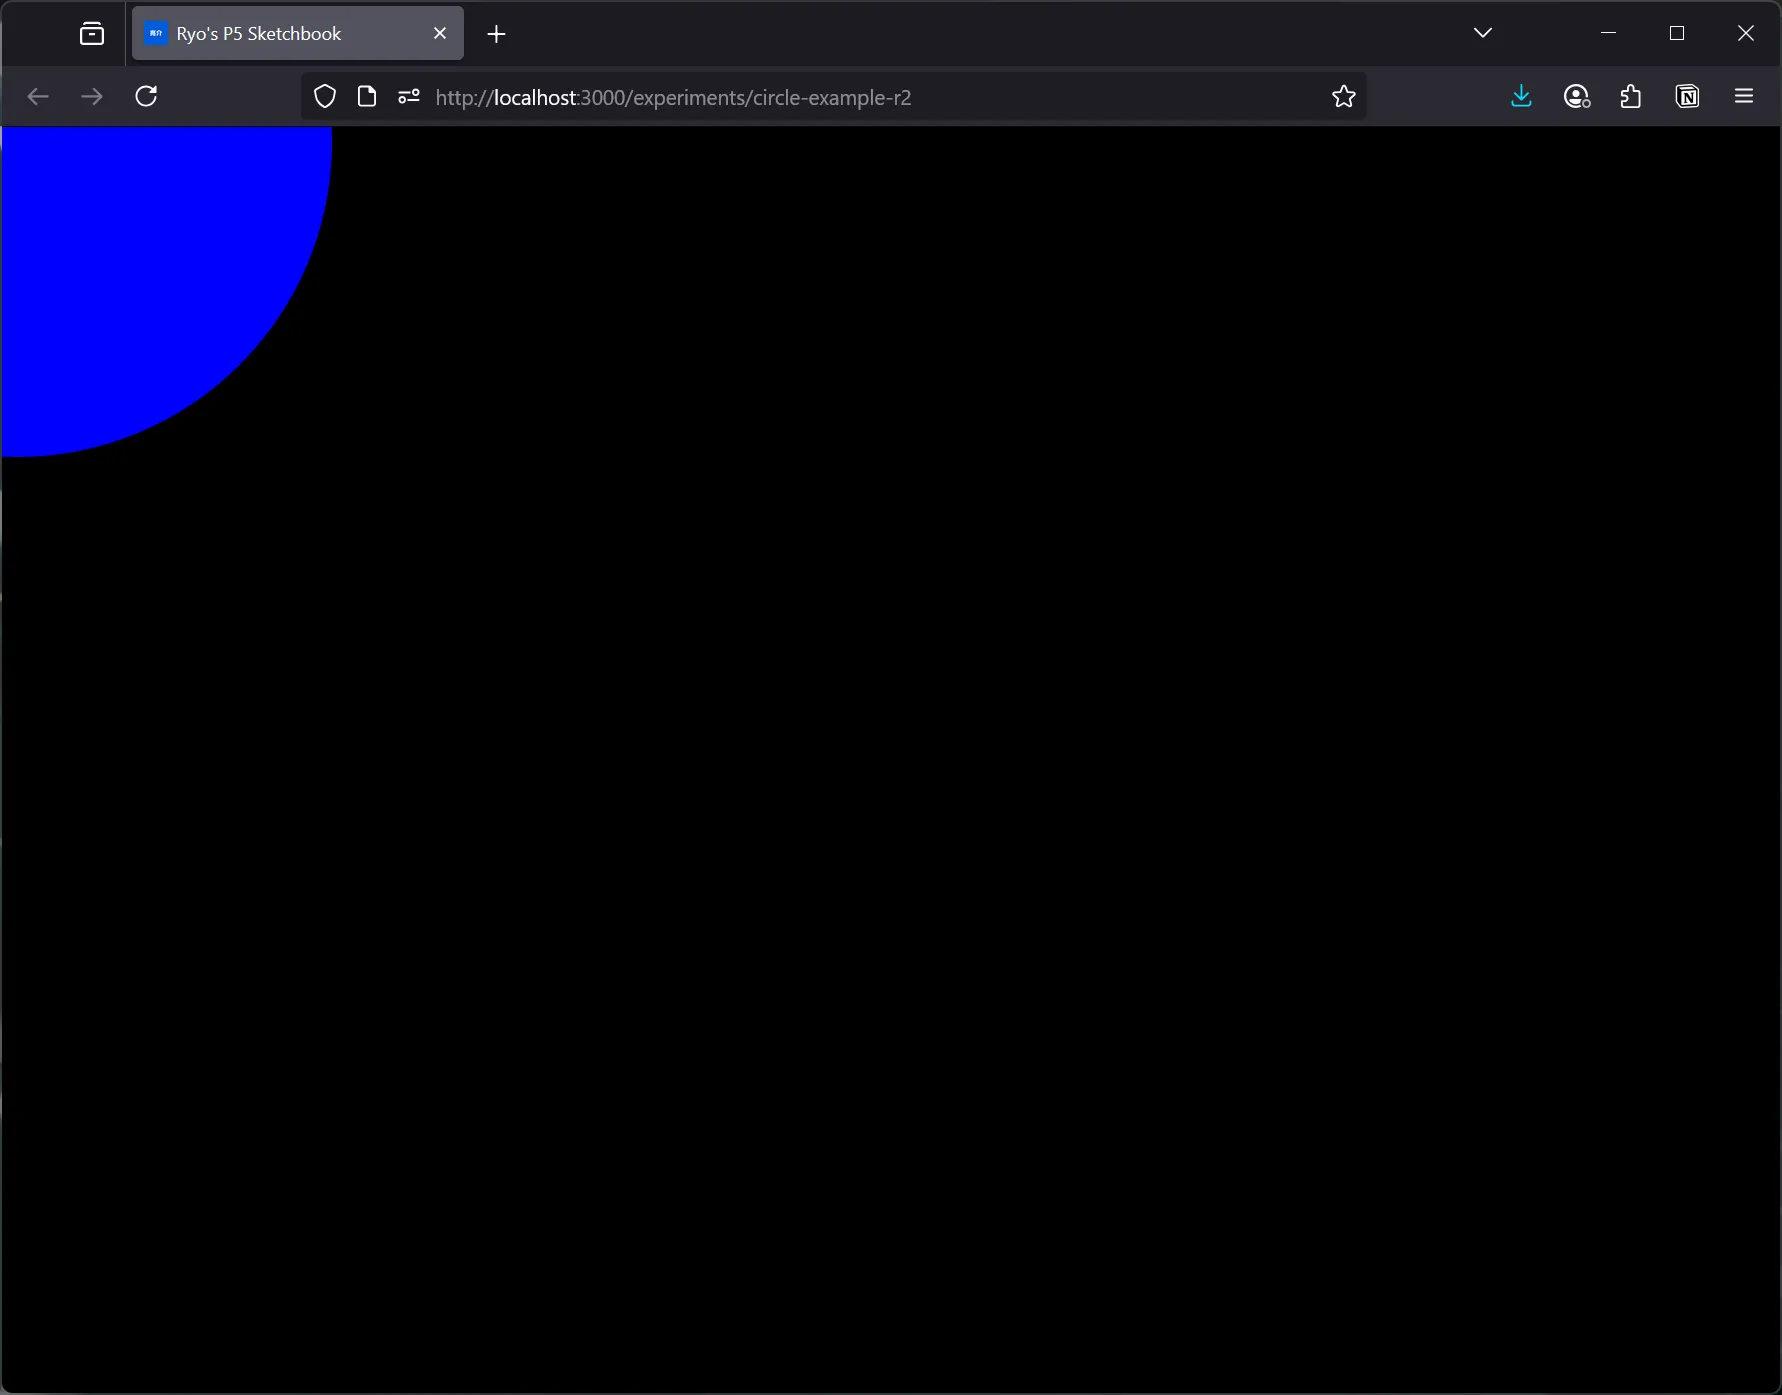
p.draw = () => {
  p.background(p.color("black"));
  p.noStroke();
  p.fill(p.color("blue"));
  p.circle(10, 10, 420);
};
This draws a static blue circle at the coordinates (10, 10) and makes the diameter 420 pixels long.
Cool, but how would we let the user control this drawing? Ideally we want the user to press on their mouse, start painting, and release the mouse to stop.
With p5, they give you access to a handy mouseX and mouseY property with the current mouse coordinates. You could also just check for this using an event listener - but this is much easier. They also have a lifecycle for checking if the mouse was pressed and moved (mouseDragged) and when it’s released (mouseReleased).
If we combine all these, we can get some nice drawing action going on:
import P5Sketch from "@/components/P5Sketch";
import p5 from "p5";
import React from "react";
import { BASE_COLORS } from "themes/colors/base";

type Props = {};

const FILENAME = "PaintWithMouseR1";

const PaintWithMouseR1 = (props: Props) => {
  const Sketch = (p: p5) => {
    let drawing = false;
    p.setup = () => {
      console.log("setup canvas");
      p.createCanvas(window.innerWidth, window.innerHeight);
    };
    p.draw = () => {
      // We specifically don't draw a BG or "clear" so previous frames are saved and stacked (creating the drawing effect)
      // p.background(p.color(BASE_COLORS["gray-9"]));

      // If user isn't pressing, don't draw
      if (!drawing) return;
      p.noStroke();
      p.fill(p.color(BASE_COLORS["blue-5"]));
      p.circle(p.mouseX, p.mouseY, 10);
    };

    p.mouseDragged = () => {
      drawing = true;
    };
    p.mouseReleased = () => {
      drawing = false;
    };
  };

  return <P5Sketch sketch={Sketch} />;
};

export default PaintWithMouseR1;
We keep a flag called drawing that lets us knowing when the user is drawing or not. Then when the user presses on the canvas and drags the mouse around, we’ll update the flag to be true (we are in fact “drawing”).
Then in our draw() lifecycle, we can choose to render something when the user is clicking. And we’ll use the current mouse position (aka mouseX) and as the position for the new shape we’re drawing.
But how do we keep drawing and adding to the canvas without it “erasing” the previous progress every time it runs draw() again?
The real magic happens when we comment out the background() or clear() functions. When we use them normally, they do as expected. The background() function will paint the entire background whatever color you want. But when I say “background”, I mean it draws a square over the entire canvas and fills it with the color. It doesn’t add a layer behind everything with the color (like you would with a background “layer” in Photoshop or Figma).
And when I say it draws over everything — it’s literally drawing over the previous canvas. So if you don’t use background or clear, you’ll see whatever you drew last. Omitting it allows us to keep appending to the previous canvas state.
Making brushes
Now we can draw a shape - in our case a circle - wherever the mouse is while drawing. This is pretty sufficient already, as we can get pretty nice solid lines if you move slow enough while dragging your mouse.
But what if we wanted to have a softer edge for our brush? This would be nice with audio (in some cases), as it’ll let it “fade out” more instead of abruptly stopping.
Instead of drawing a circle() - we need to use another p5 feature: the image(). The image() function does exactly what it sounds like, it renders a provided image in a certain place and size on the canvas.
So what if we replaced our circle() with an image() like this?
p.image(brushTexture, p.mouseX, p.mouseY, brushSize, brushSize);It uses a brushTexture (we’ll get to that later), and then position is just like before using the mouse position. And we can even scale our brush (like we were using a painting app like Photoshop or Procreate).
How do we create a brush texture now? Well, you could just use an image (like you would with Photoshop). You can make a nice grunge brush by taking a photo of some paint/liquid splatter and making it black and white.
Gradients in p5
But what if we wanted a soft edge brush like I mentioned before? Well we just need to make a radial gradient.
One problem - p5 doesn’t have a native way of handling gradients. Luckily they do have nice documentation on how to handle it by leveraging the underlying canvas API.
function setup() {
  createCanvas(100, 100);

  background("skyblue");

  // Style the circle using a color gradient.
  let myGradient = drawingContext.createRadialGradient(50, 50, 3, 50, 50, 40);
  myGradient.addColorStop(0, "yellow");
  myGradient.addColorStop(0.6, "orangered");
  myGradient.addColorStop(1, "yellow");
  drawingContext.fillStyle = myGradient;
  drawingContext.strokeStyle = "rgba(0, 0, 0, 0)";

  // Draw the circle.
  circle(50, 50, 40);

  describe("A fiery sun drawn on a light blue background.");
}
They essentially expose the canvas context API, which you can use to draw a gradient using the createRadialGradient API (more docs on that here). The way that API works is you create a fillStyle that has the gradient inside (similar to using p5’s own fill() method) which gets applied to anything else you draw next. In this case, we draw a circle the same size of the gradient.
Offscreen drawing
One last thing before we use our brush. As you can see in the example above, when we make the brush, it’s drawn at runtime. We could just use that function, add the mouseX coordinates to it, remove the background, and get it moving. Though this would require moving the gradient along with the circle.
But how would we use this gradient as an image() like I mentioned before? We could draw it to a canvas that’s “offscreen” (or invisible to the user) and then use that canvas to get it’s “image data” (which we can subsequently use in image()).
let offscreenTexture: p5.Graphics;
offscreenTexture = p.createGraphics(BRUSH_TEXTURE_SIZE, BRUSH_TEXTURE_SIZE);
With p5 we can use the createGraphics() function to create an “offscreen canvas” (I think it’s technically in memory). Then we can use that “texture” I created to draw on it like we would normally.
offscreenTexture.background("black");
offscreenTexture.fill("blue");
offscreenTexture.circle(10, 10, 420);
And then p5 makes it pretty easy to use it as an image, we just have to pass the “texture” we created along with some sizing parameters.
p.image(offscreenTexture, 0, 0, p.width, p.height);Now we have the core concepts needed to put this all together.
Procedural gradient as brush
Now we can create an offscreen canvas/graphic, draw our brush on it, then use it when the user clicks and drags like before.
import P5Sketch from "@/components/P5Sketch";
import p5 from "p5";
import React from "react";
import { BASE_COLORS } from "themes/colors/base";

type Props = {};

const FILENAME = "PaintWithMouseR3";
// The size of the brush texture
const BRUSH_TEXTURE_SIZE = 600;

const PaintWithMouseR3 = (props: Props) => {
  const Sketch = (p: p5) => {
    let drawing = false;
    let offscreenTexture: p5.Graphics;
    let brushSize = 1200;
    p.setup = () => {
      console.log("setup canvas");
      p.createCanvas(window.innerWidth, window.innerHeight);

      // Create a soft edge brush to use
      // Create the offscreen texture and store it in a local variable
      offscreenTexture = p.createGraphics(
        BRUSH_TEXTURE_SIZE,
        BRUSH_TEXTURE_SIZE,
      );
      const offscreenCtx = offscreenTexture.drawingContext;

      // Creates a gradient style
      let brushGradient = offscreenCtx.createRadialGradient(
        50,
        50,
        3,
        50,
        50,
        40,
      );
      // We use RGBA to go from solid to transparent color
      brushGradient.addColorStop(0, "rgba(0,0,0,1)");
      brushGradient.addColorStop(0.9, "rgba(0,0,0,0)");
      brushGradient.addColorStop(1, "rgba(0,0,0,0)");
      offscreenCtx.fillStyle = brushGradient;
      offscreenCtx.strokeStyle = "rgba(0, 0, 0, 0)";

      // Draw on canvas to use gradient style
      offscreenTexture.rect(0, 0, BRUSH_TEXTURE_SIZE, BRUSH_TEXTURE_SIZE);
    };
    p.keyPressed = () => {
      saveArt(p, FILENAME);
    };
    p.draw = () => {
      // If user isn't pressing, don't draw
      if (!drawing) return;
      p.noStroke();
      p.fill(p.color(BASE_COLORS["blue-5"]));
      // Draw "brush"
      p.image(offscreenTexture, p.mouseX, p.mouseY, brushSize, brushSize);
    };

    p.mouseDragged = () => {
      drawing = true;
    };
    p.mouseReleased = () => {
      drawing = false;
    };
  };

  return <P5Sketch sketch={Sketch} />;
};

export default PaintWithMouseR3;
We setup the offscreen graphics in p5’s setup() lifecycle. This ensures we make it once and only once (since draw() runs like 60 times per second or so). But if we needed to update the brush color or something, we could create it on demand too.
A few tips I picked up from this process?
- Don’t set the
frameRateusing p5’s function. Let it use the default, which will be the max it detects the user’s device can handle. This will improve the drawing and make lines more solid the faster you draw. - The
BRUSH_TEXTURE_SIZErepresents the “resolution” of the brush. You want it to be as big as your brush size (or ideally bigger aka higher resolution for smoother gradients).
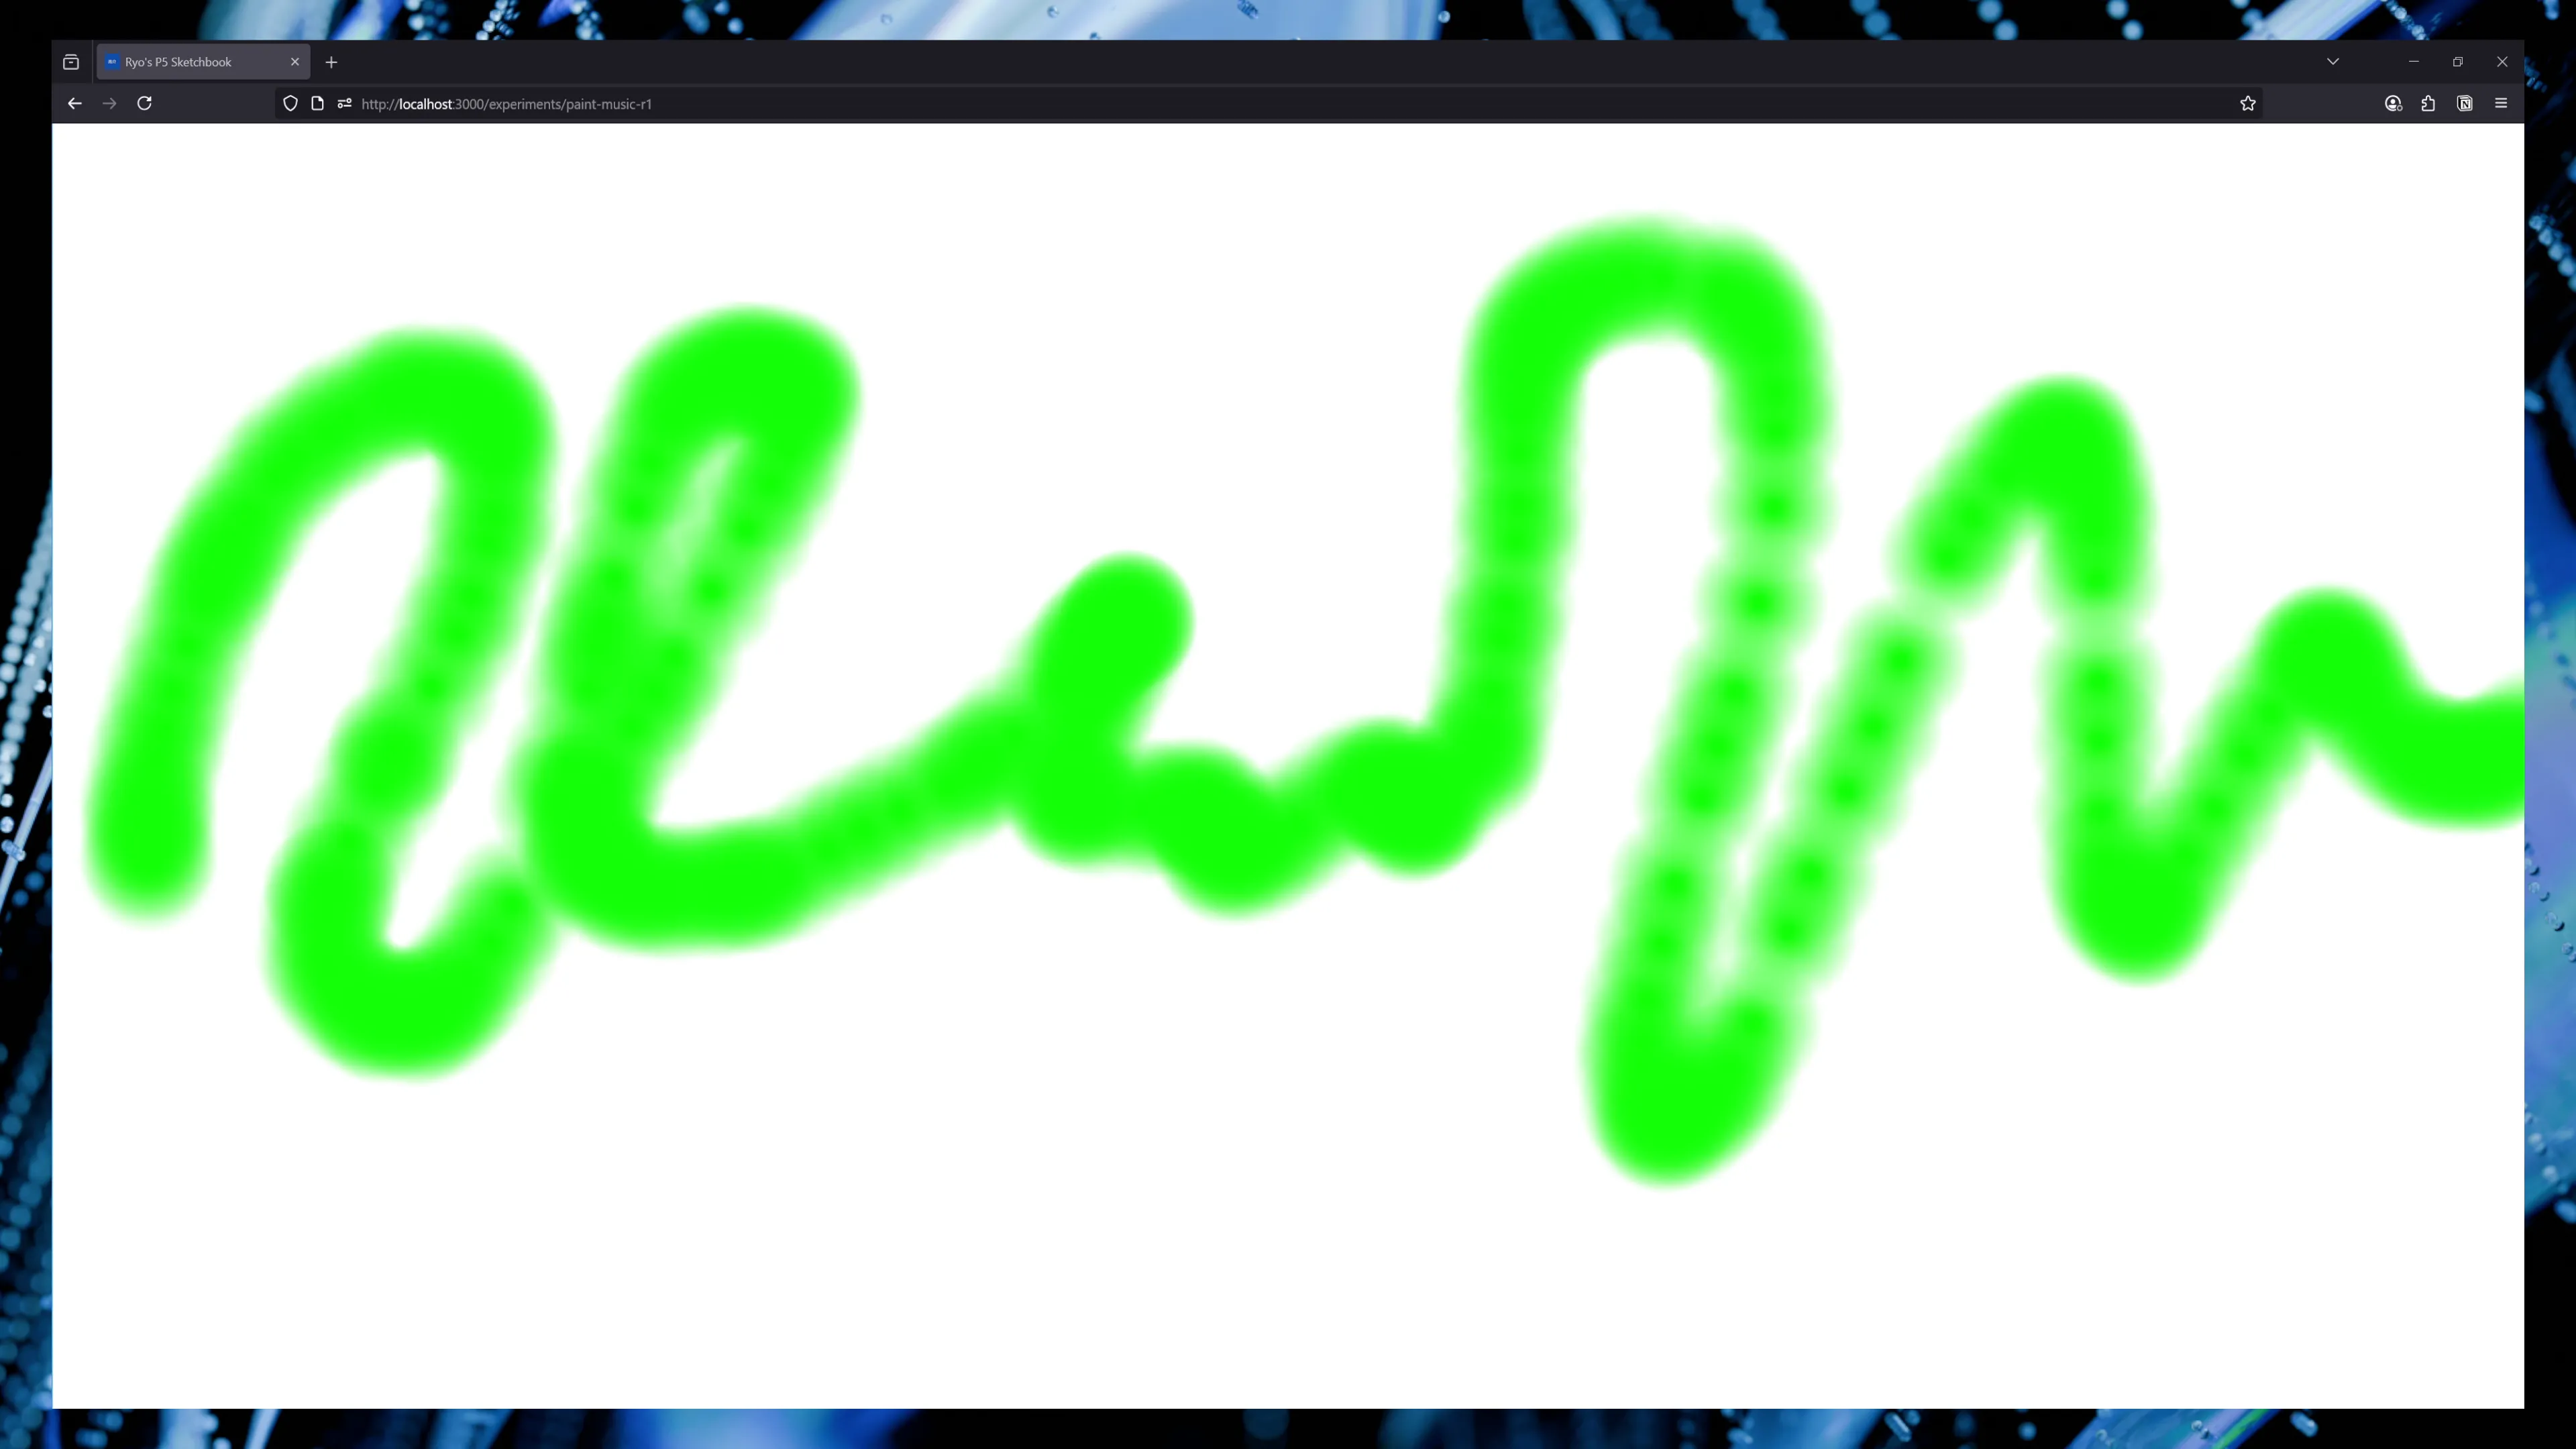
And with that we have a canvas we can paint soft gradient lines to - and we can control the color in code.
Playing sound using paint
Cool, now that we can paint, how do we translate that to sound?
Let’s break it down into a few processes: getting image data, converting image data to audio data, and playing the audio.
Getting image data
I mentioned that p5 uses the <canvas> under the hood for everything. Whenever we’re drawing something using p5, the image data is being stored in the DOM as a <canvas> element that p5 creates.
The Canvas API has a method called getImageData which lets you take a chunk of the canvas, or the whole canvas, and get it’s image information as “data”. This data is a flat array that represents each “pixel” as RGBA data.
In my React app, I use a <P5Sketch> component to run p5 in my app. It basically just runs creates a new instance of p5, passes our “drawing” function to it, and let’s p5 handle the process of creating a canvas in the DOM.
It creates the canvas inside a <div> that I specify using a React ref, so we know exactly where this canvas is in the DOM.
type Props = HTMLProps<HTMLDivElement> & {
  width?: CSSProperties["width"];
  height?: CSSProperties["height"];
  sketch: (p: p5) => void;
};

const P5Sketch = ({ width, height, sketch, ...props }: Props) => {
  const p5ref = useRef<p5 | null>(null);
  const divRef = useRef<HTMLDivElement | null>(null);

  useEffect(() => {
    if (typeof window == "undefined") return;
    if (divRef.current) p5ref.current = new p5(sketch, divRef.current);

    return () => {
      if (p5ref.current) p5ref.current.remove();
    };
  }, [sketch]);

  return <div ref={divRef} {...props}></div>;
};

export default P5Sketch;
So if we want to get this canvas information, we could set an id on this <div> and then use document.getElementById() to grab it from the DOM. And then grab the canvas inside.
Let’s make a new component that’ll handle the sampling the canvas for us and eventually playing audio, we’ll call it <PaintMusicPlayer>.
const PaintMusicR1 = (props: Props) => {
  const soundCanvas = useRef<HTMLCanvasElement>(null);

  useEffect(() => {
    function getCanvas() {
      const canvasEl = document
        .getElementById("canvas-wrapper")
        .getElementsByTagName("canvas")[0];
      console.log("checking for canvas");
      if (canvasEl) {
        console.log("got canvas", canvasEl);
        soundCanvas.current = canvasEl;
      }
    }
    setTimeout(getCanvas, 1000);
  }, []);
We grab the canvas in a useEffect hook and store it inside a ref for use later. We specifically use a setTimeout because p5 takes some time to initialize and create the canvas. We could create a shared context/store with a loaded state…but this works for a quick MVP.
Now that we have the canvas, let’s grab the data from it. But what are we grabbing? Do we just sort through the entire image information?
I mentioned earlier that Metasynth likely works by “sampling” on the horizontal axis. We’ll do something similar here. We’ll let the user press play somehow, then start a timer. This will power our movement across the canvas.
const Sketch = (p: p5) => {
  let playing = false;
  let time = 0;
  p.keyPressed = () => {
    if (p.key == "k") {
      playing = !playing;
      console.log("playing", playing);
    }
  };
  p.draw = () => {
    // Increment time if we're playing audio
    if (playing) time += p.deltaTime;
  };
};
When the user presses the k key we’ll change the playing flag to true - which lets starts incrementing the time variable in the draw() lifecycle.
Then when we move across, we can grab little chunks (maybe more aptly “slivers” or “slices”) of the image and get their image data. This will give us a contextual perspective of our image (instead of using all of it).
// In ms
const TOTAL_TIME = 6000;

const getXFromTime = () => {
  return (time / TOTAL_TIME) * p.width;
};

const playSound = () => {
  if (!soundCanvas.current) return;
  // Sample canvas for a sliver of it to detect frequency
  const ctx = soundCanvas.current.getContext("2d");
  const x = Math.floor(getXFromTime());
  console.log("sound x", x);
  // We take a 1px by `CANVAS_HEIGHT` pixel sample
  const canvasSample = ctx.getImageData(x, 0, 1, p.height);
};
We grab the canvas, calculate the X position of the slice we want to take, then grab the image data from that slice. The size of the slice is 1 pixel wide by the canvas height.
With this image data we can now transform it into sound.
Image to sound
We currently have an image, technically only a slice of it based on the current time. And when I say “image data”, it means an array of pixels represented as RGBA numbers (e.g. [255,255,255,255] is one white pixel).
When we talked about how Metasynth works, I mentioned they divide their canvas into vertical segments representing pitch/frequency. For example, the bottom of their canvas would be the C4 piano key, and top would be the B4 key. Basically the whole height represent 1 octave.
With that assumption, we can take our canvas height and divide it by 12 segments. This will represent each white and black key on the piano in a single octave.
So if the user draws near the top, it should be a C or D key. And if it’s closer to bottom it should be an A or B key.
But how do we handle this with image data?
Since we have a slice of that’s 1 pixel wide, we can assume that every 4 numbers in the image array represents 1 pixel. Meaning that we can determine what “segment” the pixel is in by mapping it’s range from the it’s array index and length to 0-11 (the number of piano keys).
const data = canvasSample.data;

// Loop over each segment and average the color
let segments: Array<Array<number>> = [];
for (let i = 0; i < data.length; i += 4) {
  // const currentSegment = Math.floor(noteSegmentSize * i);
  const currentSegment = Math.ceil(p.map(i, 0, data.length, 0, 11));
  console.log("current segment", currentSegment);

  // data[i] // red
  // data[i + 1] // green
  // data[i + 2] // blue

  // console.log("green data", data[i + 1]);
  if (!Array.isArray(segments[currentSegment])) segments[currentSegment] = [];
  segments[currentSegment].push(data[i + 1]);
}

console.log(
  "segments",
  segments[4].filter((sample) => sample > 0),
);
// We average the color samples of each segment - and map them to 0-1 (from 0-255 color range)
const segmentsAveraged = segments.map(
  (segment) => segment.reduce((a, b) => a + b) / segment.length / 255,
);
console.log("averaged array - ideally notes?", segmentsAveraged);
First we create an array called segments that store arrays of numbers for each piano key “segment”. This will let us average each section out later easily.
We loop over the image data every 4 values (basically a pixel at a time) and grab each green value and store it inside an array in the segments array.
Then we average out each segment to see how much of an “effect” the green color had. The more green in a section, the higher the number (ranging from 0 no green to 1 full of green)
So what can we do with that kind of data?
Pump up the noise
We want each segment to represent a different note being played. So we’ll need to have some “notes” to “play” somehow. Ideally we want the amount of green to represent how “intense” or “loud” a sound is. We can control this in audio using the concept of “gain” (essentially the volume knob on your speaker).
We’ll spawn 12 oscillators, one for each note, and attach a dedicated GainNode to each one to control it’s volume. Then as we “play audio” (aka playing is true and the time variable increments), we’ll update each oscillators corresponding gain node with our image data (that we converted into a 0 to 1 number).
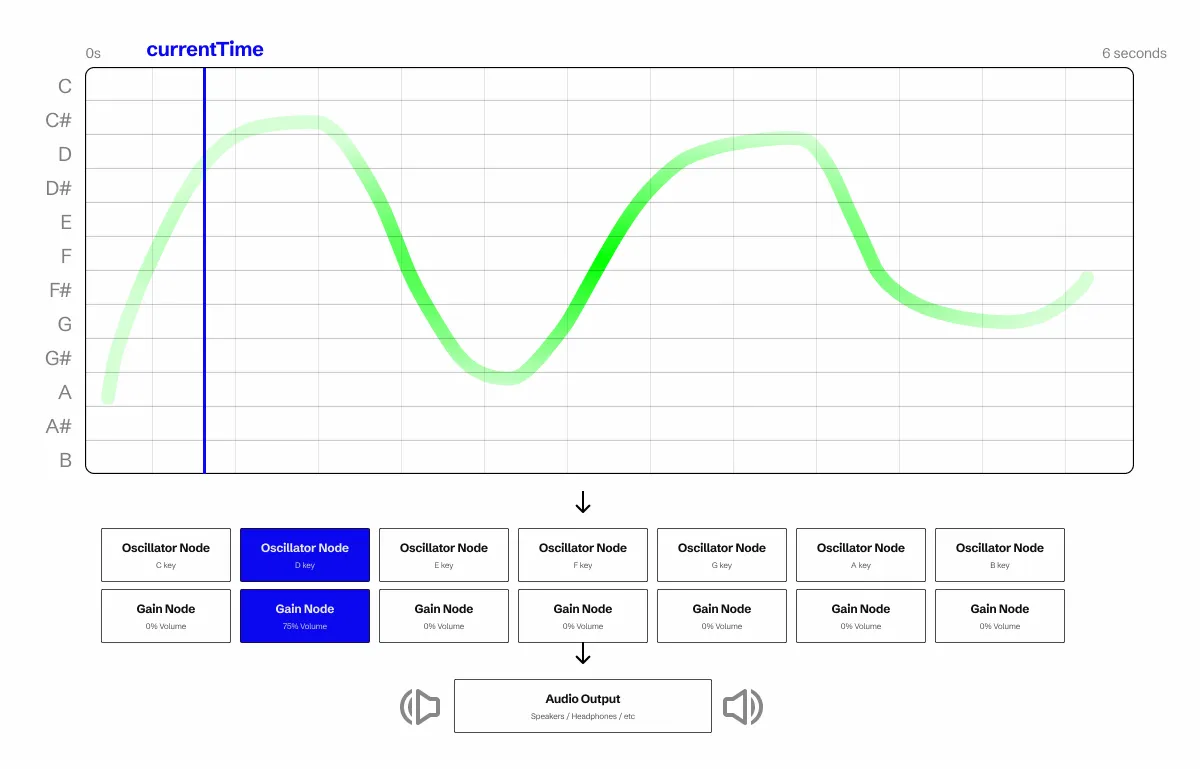
⚠️ The reason we attach a
GainNodeto each oscillator is because of the way oscillators work. Once they’re started, they can’t be “paused”. They stop and get destroyed, requiring you to recreate them. To simplify this process, when we don’t want to hear an oscillator, we just turn it’s volume down to 0% — then raise it when we need it. This keeps the oscillators active and available more quickly.
Here’s what that’d look like in practice.
type FreqNode = {
  osc: OscillatorNode;
  gain: GainNode;
};

const PaintMusicR1 = (props: Props) => {
  const Sketch = (p: p5) => {
    let audioCtx: AudioContext = null;
    let freqNodes: FreqNode[] = [];
    p.setup = () => {
      console.log("setup canvas");
      p.createCanvas(window.innerWidth, window.innerHeight);
      p.stroke(255); // Set line drawing color to white

      // setup audio
      audioCtx = new AudioContext();

      // Setup 12 oscillators for each note that needs to play
      new Array(12).fill(0).forEach((_, index) => {
        const gain = audioCtx.createGain();
        // Start volume at 0
        gain.gain.value = 0;

        // Create oscillator
        const osc = audioCtx.createOscillator();
        osc.type = "sine";
        // Oscillators use frequency to determine "sound".
        // 440hz = A4 note, 220hz = A3 note.
        // We map from C4 to B4 (which is 261-492 Hz)
        // Ideally if you wanted to change octave just 1/2 or double as needed.
        osc.frequency.value = p.map(index, 0, 12, 261, 493);

        // We connect oscillator to gain
        // To make sound - we just connect/disconnect gain node from output
        osc.connect(gain);
        gain.connect(audioCtx.destination);

        // The way oscillators work - once you stop, they have to be recreated
        // So we start here and when we want to play, we connect oscillator to output.
        // And to stop playing, we disconnect it
        // but in our case - we'll just turn the volume down -- even simpler!
        osc.start();

        freqNodes.push({ osc, gain });
      });
    };
We create a FreqNode type that’ll represent our oscillator and gain node combination. And we’ll store them in a freqNodes array at the top of our Sketch function (making it available to any other callbacks, like draw()). Then in our setup() lifecycle, we loop over an empty array we initialize with 12 items, and spawn the 12 oscillators and gain nodes we need. Then store them in the freqNodes array to access later.
Now that we have our “noise makers” setup, let’s trigger their playback. We’ll use the keyPressed property to check when the user presses the k key and start or stop the playback.
p.keyPressed = () => {
  if (p.key == "k") {
    playing = !playing;
    console.log("playing", playing);

    if (playing) playSound();
    if (!playing) stopSound();
  }
};
Image to Audio Conversion
Now here’s the magic where we translate the visual data into audio data. It’s a lot of code so I’ll break it down piece by piece, but you can see the full code here.
The first thing we need is the canvas with our drawing. We grab that using the ref we have saved. Then we use the getImageData() method on the canvas’ context to grab all the pixel information from our canvas.
if (!soundCanvas.current) return;
// Sample canvas for a sliver of it to detect frequency
const ctx = soundCanvas.current.getContext("2d");
const x = Math.floor(getXFromTime());
console.log("sound x", x);
// We take a 1px by `CANVAS_HEIGHT` pixel sample
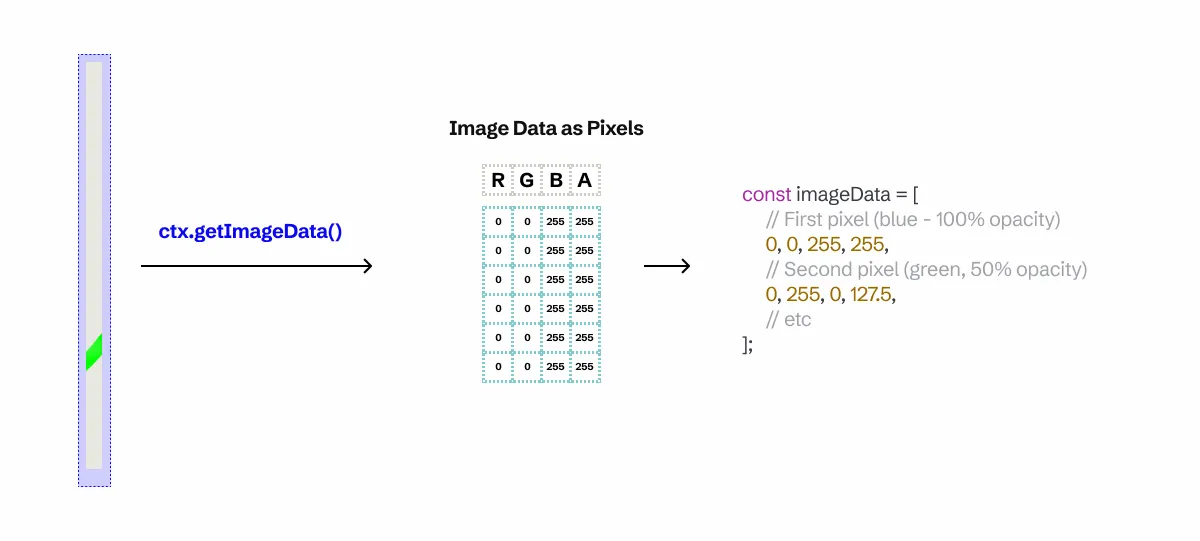
const canvasSample = ctx.getImageData(x, 0, 1, p.height);When I say pixel data, I literally mean that. getImageData() returns a flat array of floats (aka numbers) that represent red, green, blue, and alpha color channels.
Logically, you’d want to do something like this and just make an array of “pixels”, that contain the our 4 color numbers (RGBA):
type Pixel = [number, number, number, number]; // RGBA numbers
type ImageData = Pixel[];
But the information is in a flat array, so it’s more like:
type ImageData = number[];

// Assume our image is 2x1 pixels
const imageData = [
  // First pixel (blue - 100% opacity)
  0, 0, 255, 255,
  // Second pixel (green, 50% opacity)
  0, 255, 0, 127.5,
];
You also might notice that we pass a couple values into the getImageData(). These are x, y, width, and height variables. In our case, we’ll be sampling a “vertical slice” of our canvas. If we assume the canvas is 6 seconds long in time duration, we can map where we take our slice based on the current playback time (provided by the audio context).

Our first step to organize the pixels into “segments” that represent each piano note. We’ll take a 1 pixel wide “slice” of our image, so we can assume that every pixel we traverse is vertically. We’ll loop over the canvas data 4 units at a time (basically 1 pixel at a time). Then we can take the length of the array and divide it by 12 (the number of notes we need), and move each pixel into it’s respective segment based on it’s array index.
const data = canvasSample.data;
// console.log("canvas data", data);

// Image data contains RGBA, so this tells us how many "colors" or "pixels" we're sampling
const dataSize = data.length / 4;
const noteSegmentSize = data.length / 12;

// Loop over each segment and average the color
let segments: Array<Array<number>> = [];
for (let i = 0; i < data.length; i += 4) {
  // const currentSegment = Math.floor(noteSegmentSize * i);
  const currentSegment = Math.ceil(p.map(i, 0, data.length, 0, 11));
  console.log("current segment", currentSegment);

  // data[i] // red
  // data[i + 1] // green
  // data[i + 2] // blue

  // console.log("green data", data[i + 1]);
  if (!Array.isArray(segments[currentSegment])) segments[currentSegment] = [];
  segments[currentSegment].push(data[i + 1]);
}
I specifically grab the green pixel data here, but you could use any color (or the alpha).
With these segments in place, we can average out the data to get an idea of the overall effect of the user’s drawing in a certain segment.
// We average the color samples of each segment - and map them to 0-1 (from 0-255 color range)
const segmentsAveraged = segments.map(
  (segment) => segment.reduce((a, b) => a + b) / segment.length / 255,
);
console.log("averaged array - ideally notes?", segmentsAveraged);
Now we can update the gain nodes attached to each oscillator (representing a piano note).
// Play notes using the averaged data
// In this case we'll use green color to control volume
updateOscillatorsIntensity(segmentsAveraged);

// Somewhere else in the code...
const updateOscillatorsIntensity = (volumes: number[]) => {
  freqNodes.forEach((node, index) => {
    node.gain.gain.value = volumes[index];
  });
};
And with that, we have music playing based on where the user draws on the canvas and how saturated it is.
Let’s spice up the app with a few more key visualizations to help the user understand the process.
Playhead marker
Let’s create a timeline marker to let the user know what part of the canvas we’re playing.
We’ll need a time variable to keep track of the current playback time so we can draw a nice animated line on top of the sample waveform.
const Sketch = (p: p5) => {
	let playing = false;
	let time = 0;
	p.draw = () => {
	  p.clear();
	  // p.background(p.color(BASE_COLORS["gray-9"]));
	  if (playing) {
	    // console.log("time", time);
	  }

	  p.noStroke();
	  p.fill(p.color(BASE_COLORS["blue-5"]));
	  const x = getXFromTime();

	  p.rect(x, 0, 1, p.height);

	  if (playing) time += p.deltaTime;
}
In the draw() method we can sync our time variable with the deltaTime from p5.
⚠️ Ideally we’d use the time from the audio context, but I was working a little fast here. For that, instead of incrementing the time you’d just sync it with
audioCtx.currentTime. But since we start our oscillators and never stop them, the time will increment infinitely as soon as the app loads up. So you’ll need to store astartTimevariable when the user presses play, then subtract it from the audio context’s current time — and that’ll give you the “real” playback time.
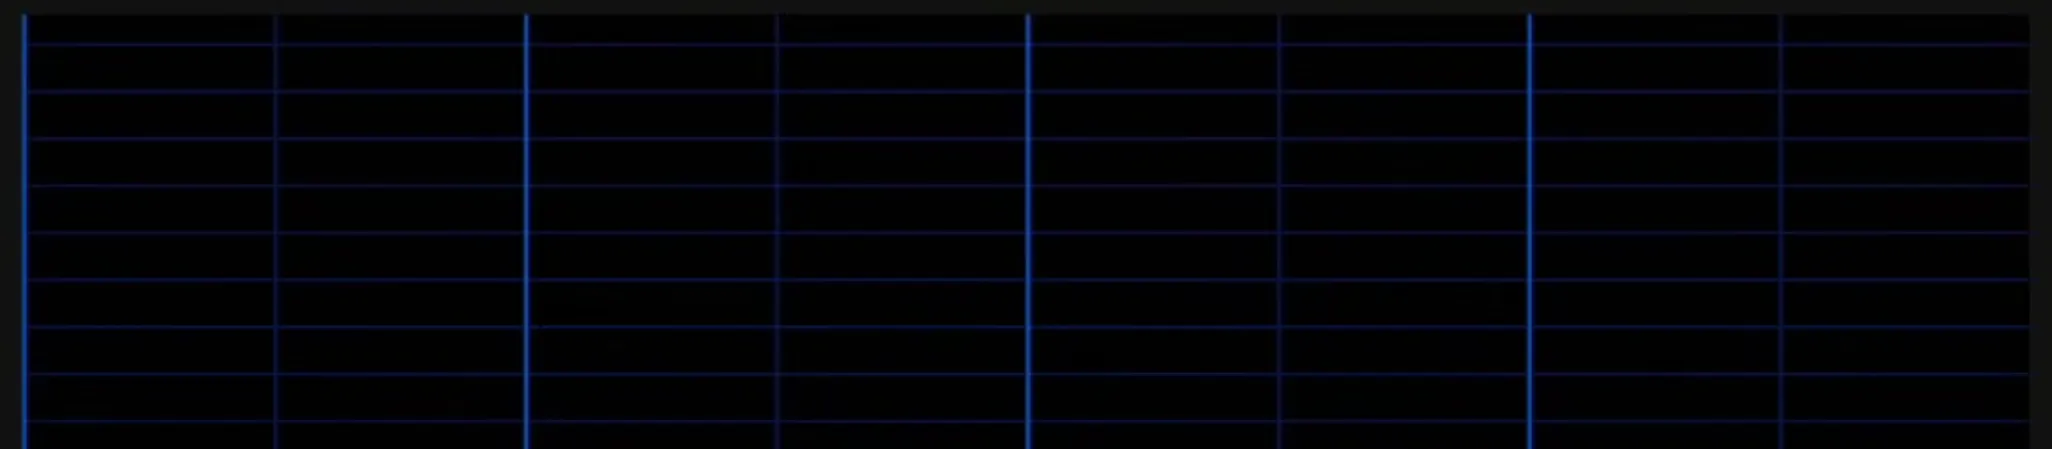
Adding grid lines
We can also help the user understand how their painting effects the noise by adding lines to denote the different sections we’ll be checking. If we divide the canvas into 12 segments vertically, those should represent the “zones” that you should paint inside of to trigger playing a particular note.
I had a nice grid line function laying around from previous experiments, but I modified it a bit to make it more extensible:
export const createGridBoxes = (
p: p5,
xNumLines: number,
yNumLines?: number,
strokeWeight: number = 1.5,
xColor: string = BASE_COLORS["gray-1"],
yColor: string = BASE_COLORS["gray-4"],
) => {
p.strokeWeight(strokeWeight);
const yNum = yNumLines ?? xNumLines;
for (let x = 0; x < xNumLines; x++) {
for (let y = 0; y < yNum; y++) {
const newX = p.map(x, 0, xNumLines, 0, p.width);
const newY = p.map(y, 0, yNum, 0, p.height);
p.stroke(p.color(xColor));
p.line(newX, 0, newX, p.height);
p.stroke(p.color(yColor));
p.line(0, newY, p.width, newY);
}
}
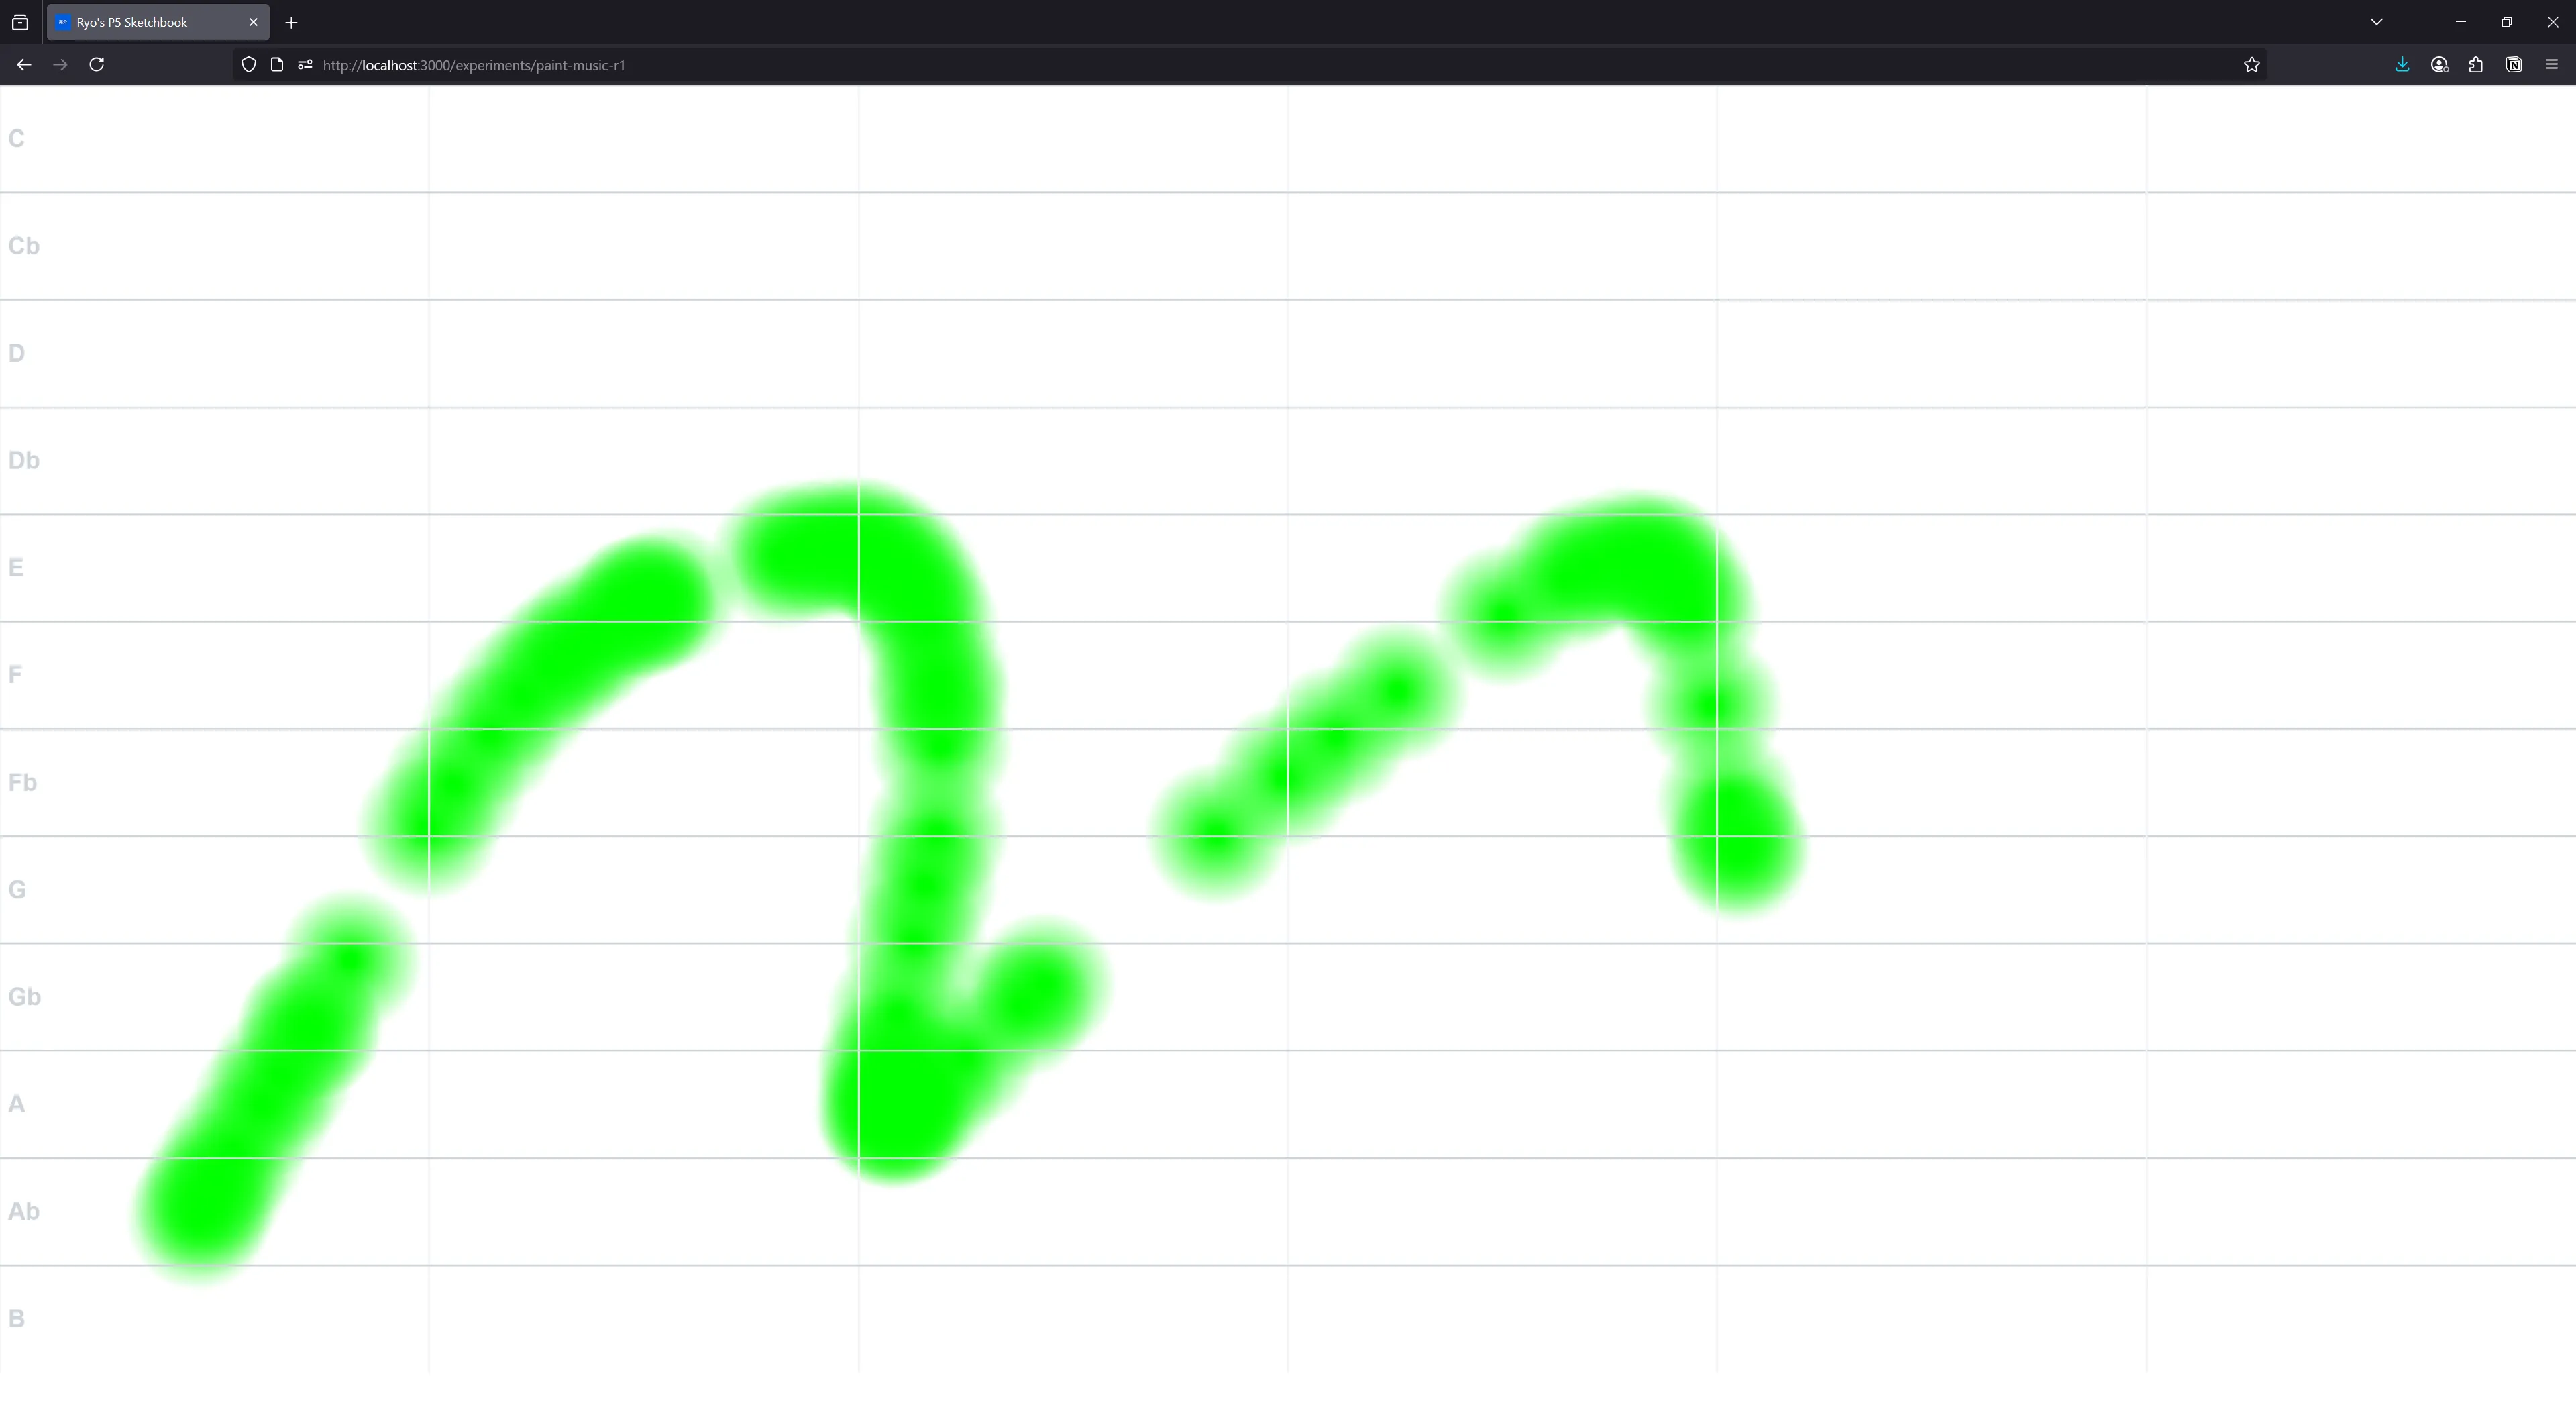
};And with this we can create some grid lines and even add text labels:
createGridBoxes(p, 6, 12);
const gridSegmentHeight = p.height / 12;

p.noStroke();
p.fill(p.color(BASE_COLORS["gray-4"]));
p.textStyle("bold");
p.textSize(24);
new Array(12).fill(0).forEach((_, index) => {
  p.text(
    NOTE_LETTERS_WITH_BLACK[index],
    8,
    gridSegmentHeight * (index + 1) - gridSegmentHeight / 2 + 8,
  );
});
Nice, looking more put together. Ideally we’d want the lines below the canvas, which would require us to draw on a 3rd canvas (one pushed behind our drawing one).
What’s next?
You could take this and keep implementing features that Metasynth offers, like splitting the audio channels for red and green colors — or any of the wild quantization techniques they use like converting the painting to more standard beat patterns. Or mix in a sampler instead of oscillators to get a better sound.
Hope this inspires you a bit and gets you coding something creative. As always, if you enjoyed this blog let me know on socials! It’s always nice to hear. And feel free to share any cool projects you create based off this.
Stay curious, Ryo